Fig. 3
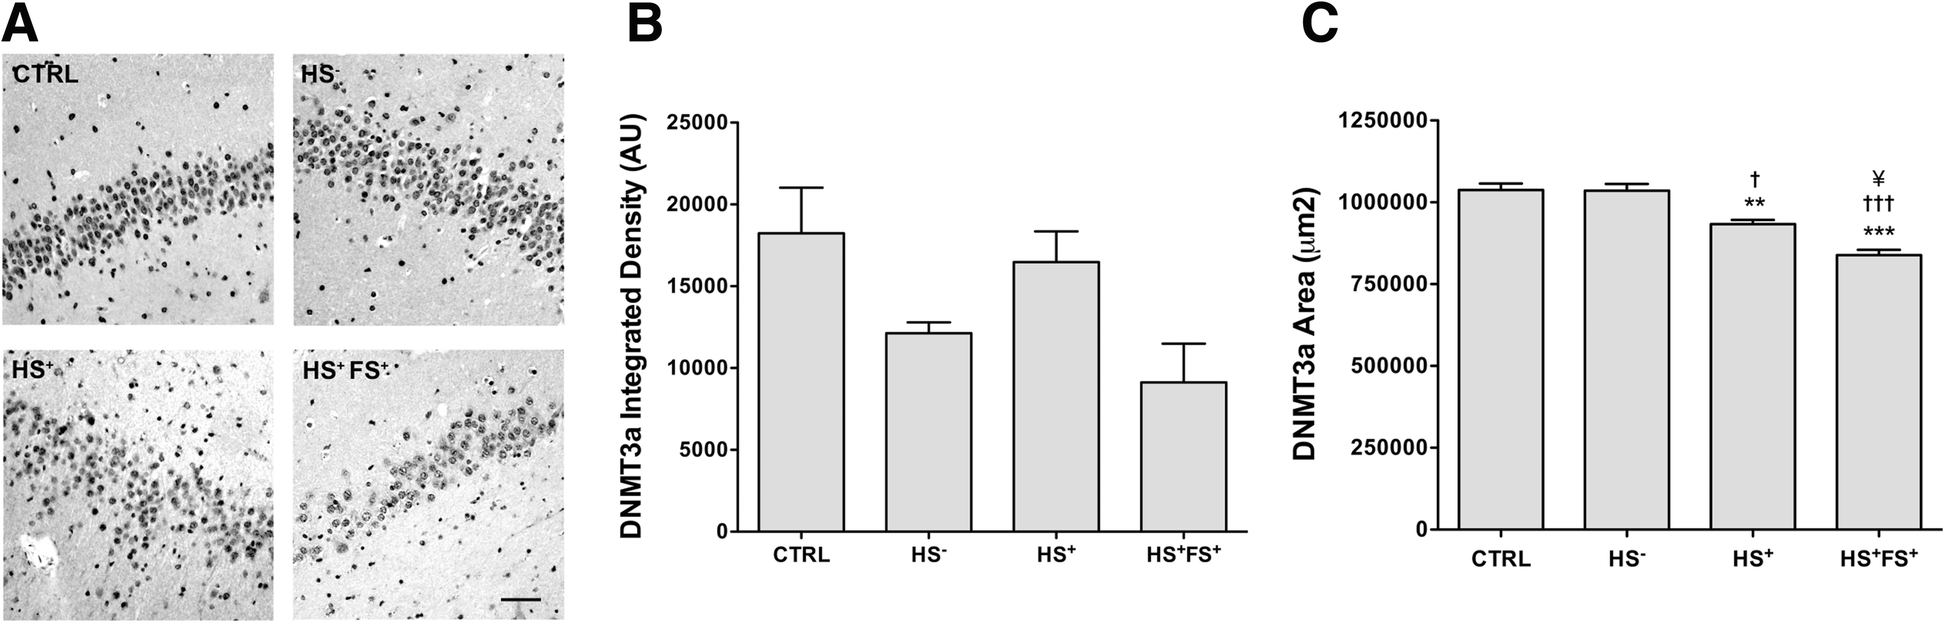
DNMT3a immunoreactivity in the hippocampal DG. a Representative pictures of DNMT3a staining in the hippocampal DG of TLE patients and controls. Scale bars represent 100 μm. b ImageJ quantification of the integrated density of DNMT3a staining. c Stereological quantification of the area expressing DNMT3a. Error bars show SEM in b and CE in c. **p < 0.01 for significant difference to CTRL. †p < 0.05 and ††p < 0.01 for significant difference to HS− group. ¥ p < 0.05 for significant difference to HS+ group. CTRL = control; HS− = TLE without HS; HS+ = TLE with HS; HS+FS+ = TLE with HS and FS.