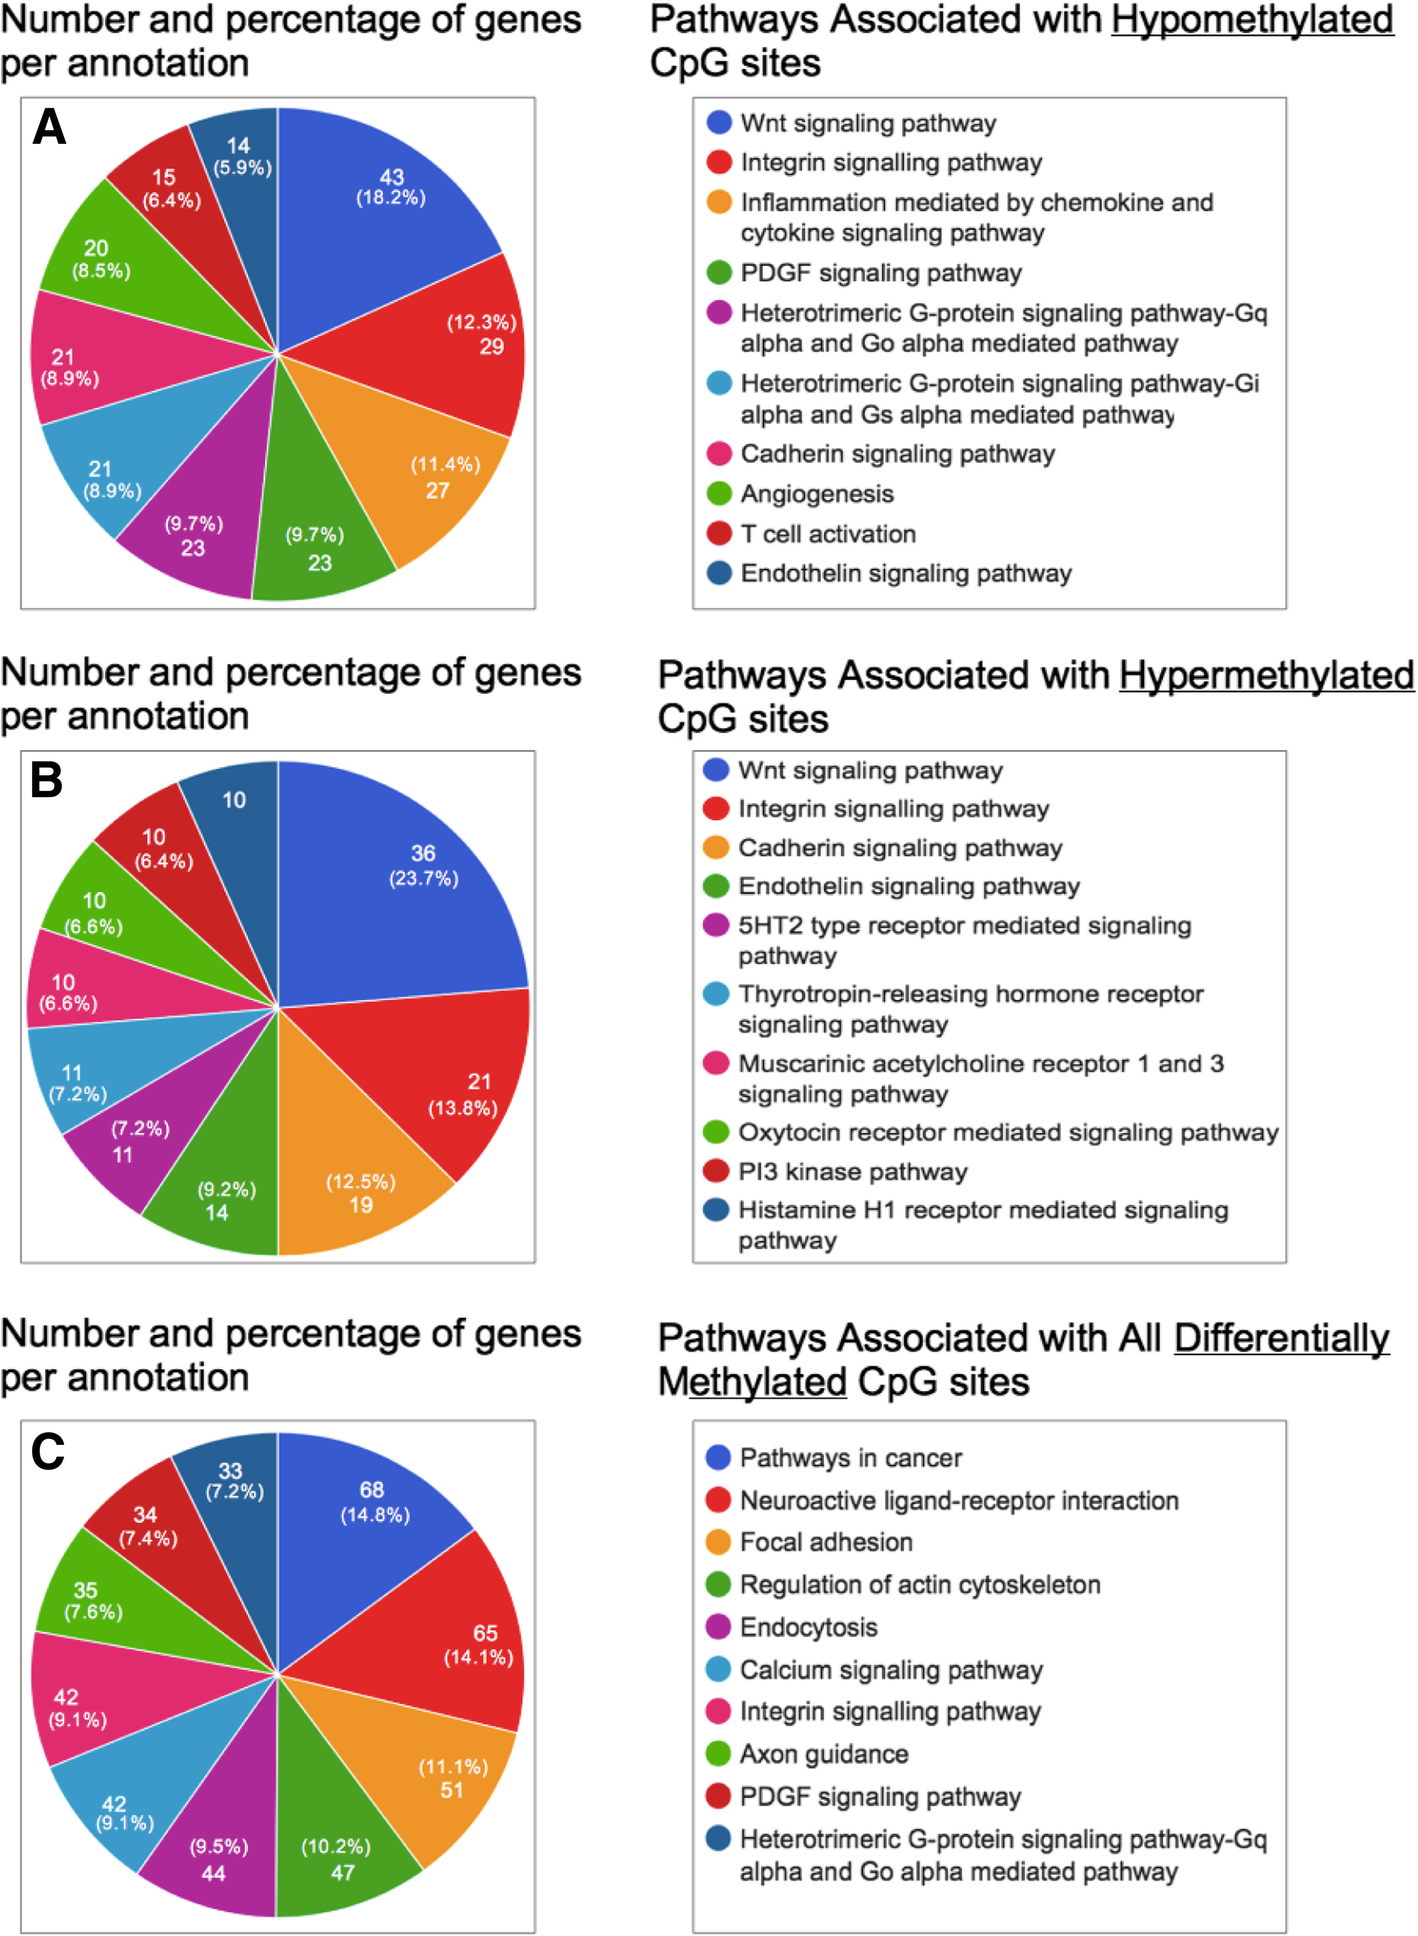
Fig. 1

Pathway analysis of differentially methylated genes identified by MC-Seq of cumulus granulosa cells (CGCs). Pie charts displaying gene ontology (GO) and pathway analyses for the lists of hypomethylated genes (a), hypermethylated genes (b), and all differentially methylated genes (DMGs) (c) between CGCs of controls (C-CC, n = 3) and women with PCOS (P-CC, n = 3) have been shown in the figure. Analysis was carried out using the GeneCodis3 web tool. Each chart represents the top ten pathways enriched in each of the three datasets